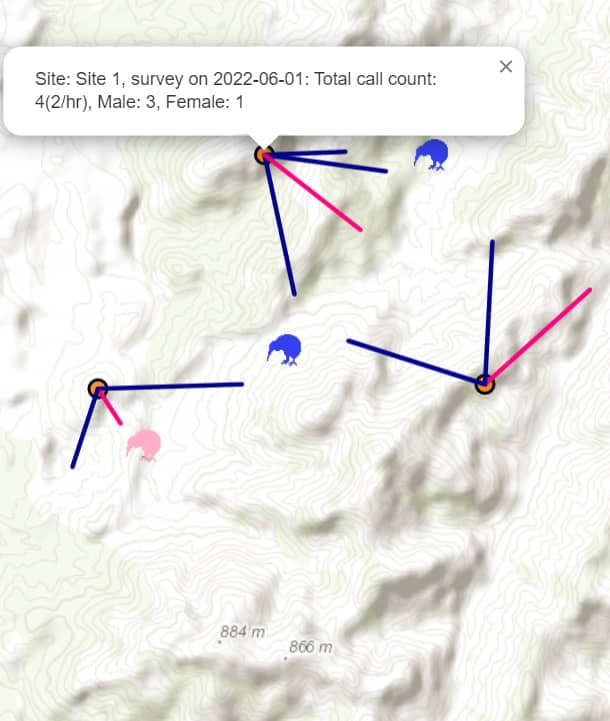
Map It! is an online tool designed for those community groups that are interested in analyzing and mapping the data obtained from their kiwi listening and bat monitoring surveys. For kiwi, the tool takes as input the site location and the call details and it creates a color coded directional ray map that shows the calls recorded at any particular site. When two or more sites are mapped together, it is quite easy to triangulate the calls and identify the area where the kiwi called from. The interactive map allows the user to add kiwi on the map and save their coordinates in a GPX format. For bats, the tool takes as input the site survey location and the total number of passes it creates a color bubble map that makes it easy to visualize the location and the number of passes at each survey map. An intuitive interface facilitates the data entry either manually or by loading a CSV file..
An intuitive, easy to use interface that is friendly to those preferring to be in the field rather than in front of a computer. Built-in validation rules, multiple choices, and pre-filled fields minimize mistakes and ensure consistency.
The data can be viewed, sorted, filtered, and exported via intuitive buttons.
The GPS information uploaded into the app is automatically mapped giving a clear view of the kiwi calls or bat passes. An easy to use map interface allows the creation of new data points (where the kiwi are deemed to be) and the export of those points to a GPX file.
The data can be entered and viewed by designated members of a community group using individual login credentials. The application is designed such that each group can see its own data only.
Each map can be saved as a pdf or as an image that can be added to a report.
Each team member can download any of the data entered by the team for more in-depth analysis. All data can be saved in a spreadsheet/pdf format for additional reporting.
Click on the Demo button on the main page above and use the demo account to look at our fictional sample project. Get familiar with the dashboard, the tables, the charts, and the automatically generated maps.
Read the documentation provided and decide on whether you are going to use the tool on your own or if you would need some support. Choose one of our plans and head to the Order section.
Our team will setup your group, add the users required, and you are good to go! With the knowledge gained from the demo and from the online documentation you can start entering your data.
Share your results with the wider community. The maps that you create can be shared as pictures or as pdf files.
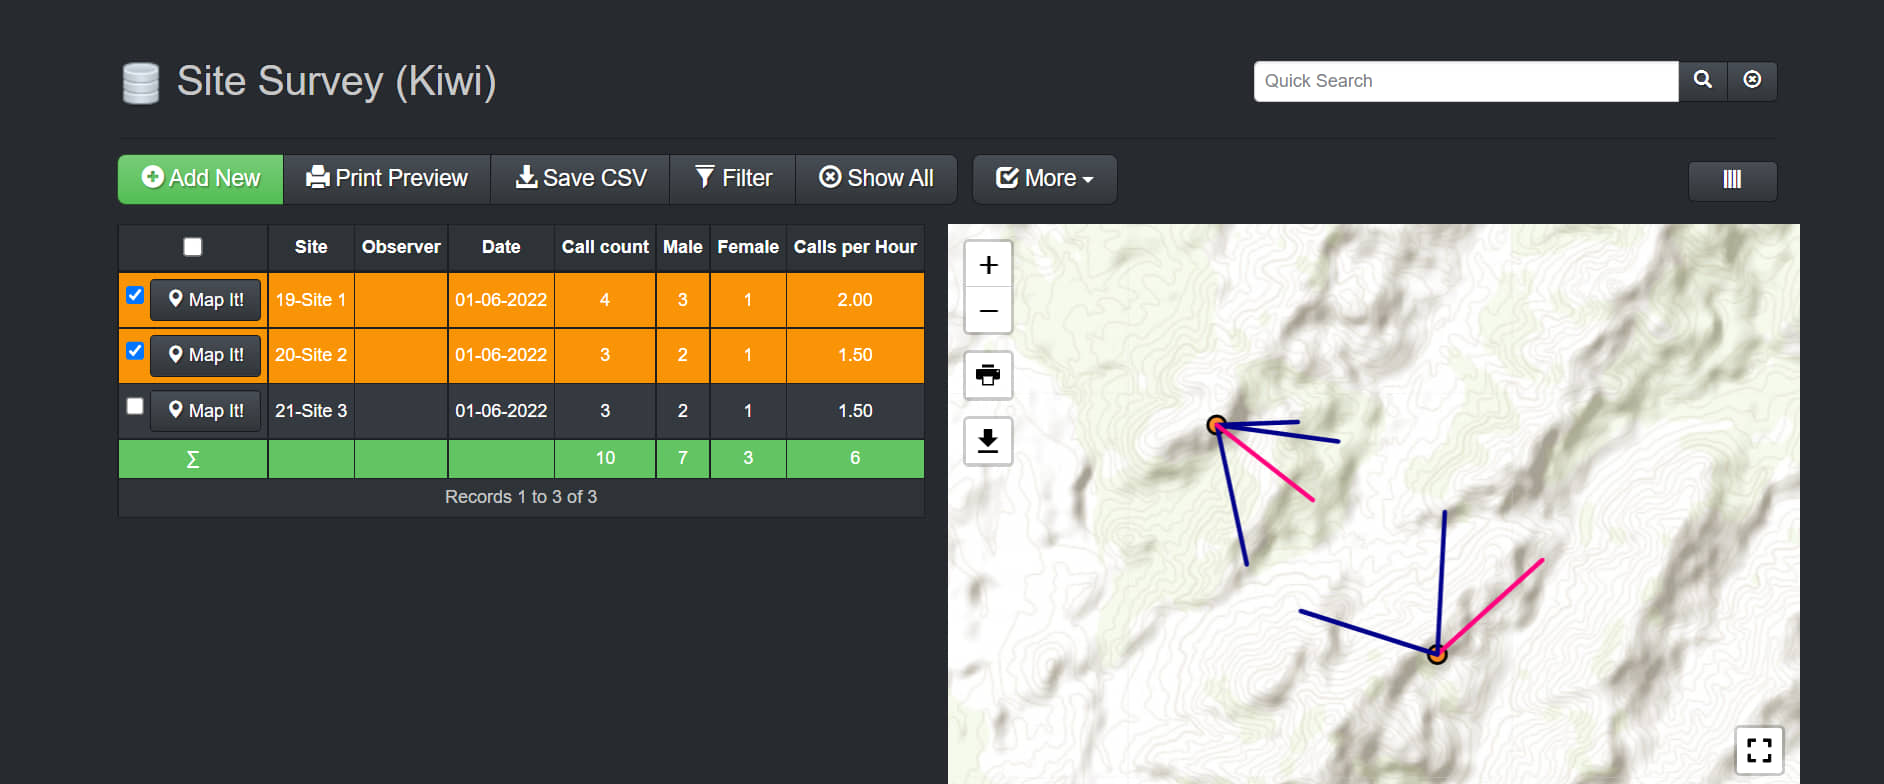
Side by side survey mapping to confirm data entry and to perform close site triangulation
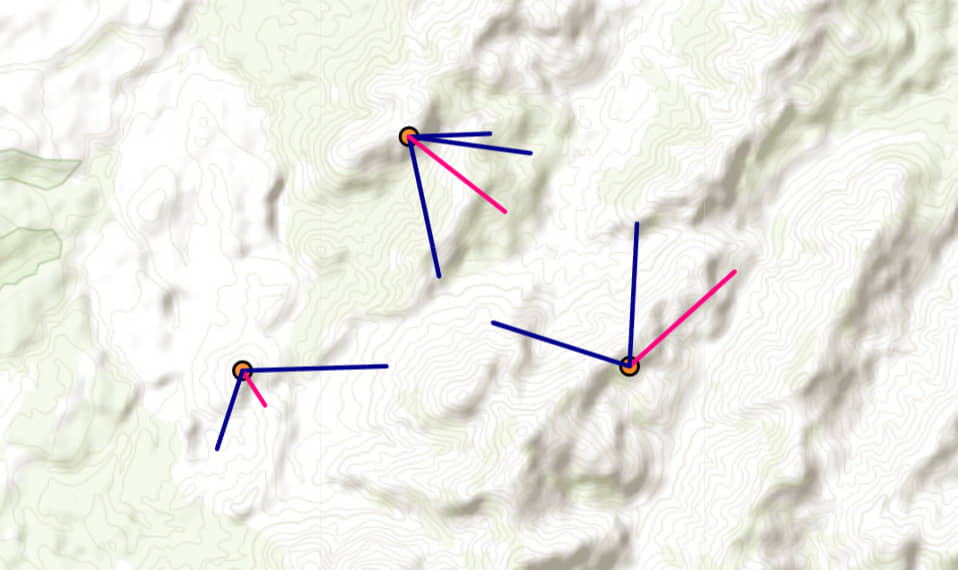
Mapping of kiwi calls from all sites, color-coded for male/female and showing the relative distance
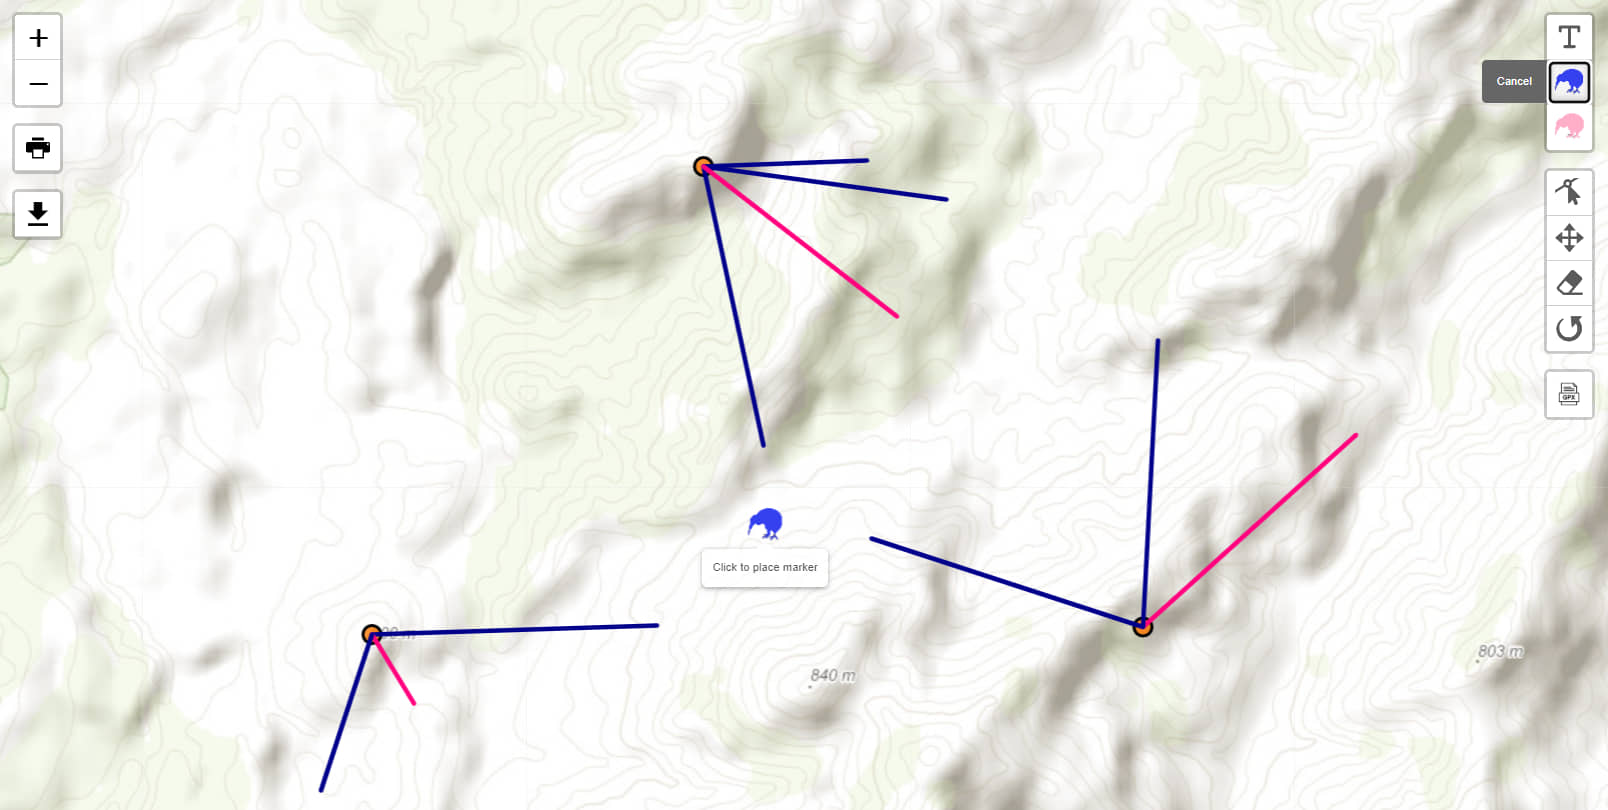
Map editor that allows call analysis, placement of markers indicating kiwi location, pdf and jpeg export of the map, and GPX export of the new kiwi markers
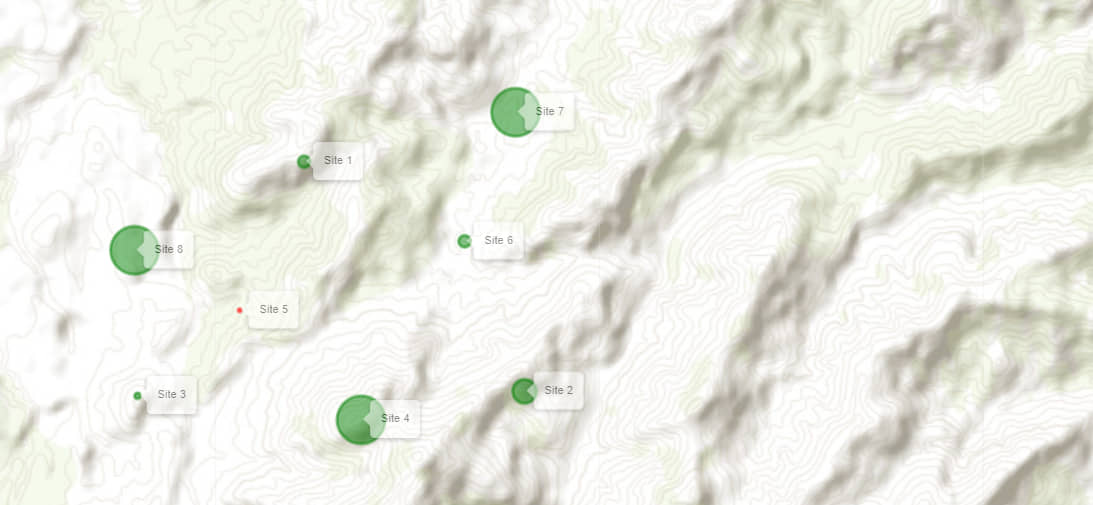
Mapping of bat survey results indicating the relative difference in the number of passes per night
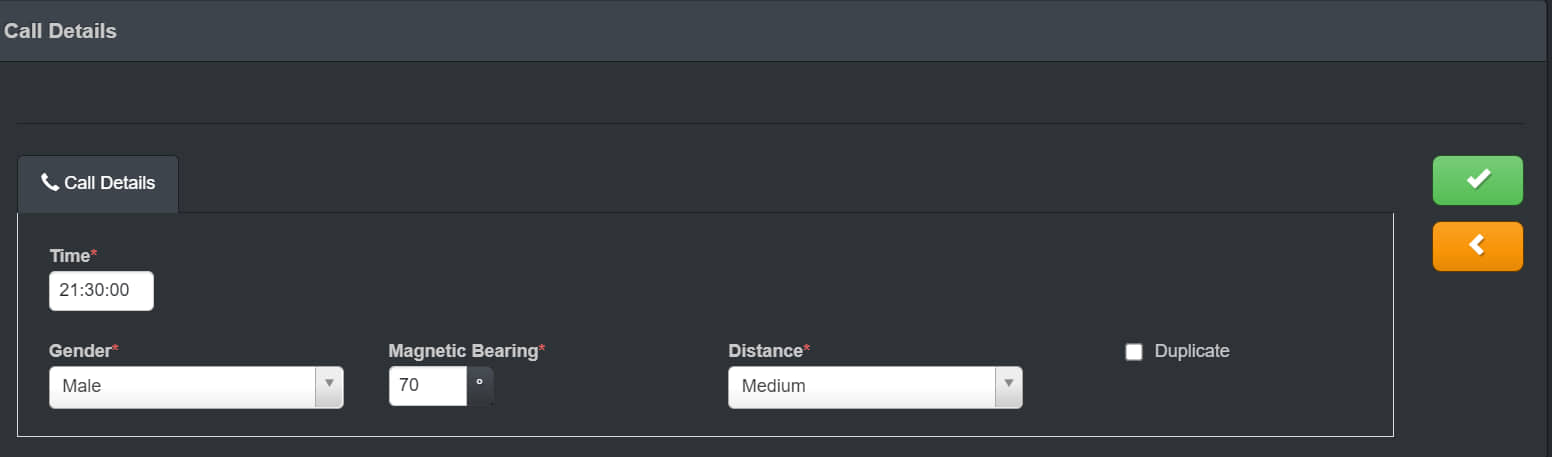
Intuitive forms that allow easy data entering with pre-filled values and error checking algorithms
Map It! is an easy to use tool that can be mastered in minutes. Everyone should be able to use it on their own, however if you need a little boost to get started, we can help.
$50
Every 3 Years
$40
Every 3 Years
$70
Every 3 Years
Not enough time or man-power to enter the data? We can help out by entering your data and providing you with the access to all of the tools's features.
$50
Per Hour
Email us at kiwi@pupurangi.com with your requirements and we will set-up everything you need to get going